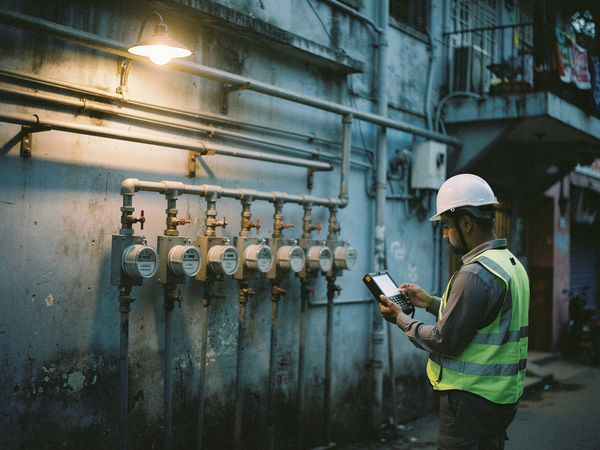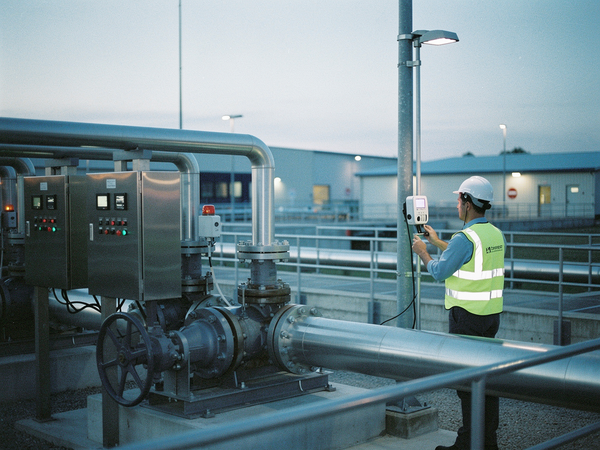
A municipal water utility in an Indian city had operated for thirty years with a single rule for night-time operations: if no visible surface flooding was reported by morning, the network was assumed intact. Every month, the unaccounted-for-water figure hovered near 32 percent, and the engineering team attributed it to aged pipes, unmetered connections, and the occasional burst that took two days to locate. When zone-level flow meters and pressure transducers were installed across twelve district metered areas, the first night of data showed something the utility had never seen before. In one DMA, the minimum night flow was 28 cubic meters per hour when the legitimate night consumption-based on known industrial users and storage refill cycles-should not have exceeded 10 cubic meters per hour. The gap between what the utility believed and what the data showed was not a matter of weeks or months. It was visible within the first twelve hours.
Night Flow Baselines Collapse Within the First Week of Live Data
The most common discovery in the first seven days of continuous monitoring is that the minimum night flow baseline, which operators had estimated from monthly bulk meter readings and occasional field checks, is almost always wrong. A utility in an Indian state found that one of its DMAs, previously considered well-performing with an estimated night flow of 15 cubic meters per hour, actually consumed 41 cubic meters per hour between 2:00 AM and 4:00 AM. The discrepancy was not caused by a single burst. It was the cumulative effect of six small leaks, three partially open washout valves, and a service connection that had been flowing continuously for an estimated fourteen months.
The reason this went undetected is straightforward. Monthly bulk readings average out the night-time signal. A flow meter read once at the end of the billing cycle sees total volume, not the temporal signature of leakage. When operators first see 15-minute interval data, they are not looking at averages. They are looking at the actual hydraulic behavior of the network during the diagnostic window-the hours when legitimate consumption is at its lowest and leakage is most visible. The first week of data typically shows that the assumed night flow baseline is 40 to 60 percent higher than the real figure, and that the utility has been operating with a systematic underestimate of background leakage for years.
Pressure Transients Reveal Structural Weaknesses That No Inspection Program Catches
By the second week, operators begin to notice patterns in the pressure data that do not correspond to any scheduled operational event. A pressure transducer at the inlet of a DMA serving 3,200 connections recorded a drop of 1.8 bar at 3:47 AM every Tuesday for three consecutive weeks. The field crew found no visible leaks, no reported bursts, and no valve operations logged for that time. The cause was a timer-controlled pump at an upstream booster station that was programmed to start at 3:45 AM for a storage tank refill cycle. The pressure drop was the hydraulic transient propagating through the network each time the pump kicked in-a pressure surge that had been occurring for years without anyone knowing.
The operational significance of this finding is not the transient itself. It is what the transient reveals about the network's structural condition. In a pipe system with intact joints and no accumulated internal corrosion, a pressure transient of that magnitude would attenuate within seconds. The fact that it propagated through the entire DMA as a measurable pressure drop indicated multiple points of weakness-joints with degraded gaskets, sections of pipe where internal tuberculation had reduced the wall thickness, and at least one service connection where the saddle clamp had loosened over time. None of these defects were visible from the surface. None would have been detected by a standard leak detection survey. The continuous pressure data turned a routine pump scheduling issue into a structural vulnerability assessment.
Field Crews and Control Room Operators Develop a Shared View of Network Behavior
Before continuous monitoring, the relationship between field crews and the control room followed a predictable pattern. The control room received a complaint call, logged it, dispatched a crew, and waited for a phone report. The crew arrived at the location, found either a visible leak or no leak at all, and reported back. If no leak was found, the complaint was closed as a false alarm. This workflow created an operational blind spot: the crew could only report what they could see, and the control room could only act on what was reported.
Continuous monitoring changes this dynamic in a specific way. When a flow anomaly appears in the data at 2:00 AM, the control room operator sees it on the dashboard before any complaint is filed. The operator can check the pressure trend, compare it to the historical pattern for that DMA, and determine whether the anomaly is a developing burst or a transient event. If the decision is to dispatch a crew, the operator can give the crew a precise location estimate based on flow balance calculations between adjacent zone meters-not a vague description of a street corner where someone reported damp ground. The crew arrives with a target zone that is typically accurate to within 50 meters of the actual leak location. The time from anomaly detection to crew arrival drops from hours to minutes, and the crew's confidence in the dispatch instruction eliminates the wasted time of searching for a leak that may not be visible.
Embedded Assumptions About Consumption Patterns Are the First to Be Invalidated
Every utility operates with a set of assumptions about how water is consumed in its network. These assumptions are embedded in everything from pump scheduling to storage tank sizing to the calculation of unaccounted-for water. A utility in a major Indian city assumed that its industrial zone consumed 80 percent of its water between 8:00 AM and 6:00 PM, with minimal night consumption. Continuous monitoring showed that the industrial zone's night consumption was 65 percent of its daytime peak, driven by batch processes in a textile plant that operated cooling towers and boiler feed systems on a 24-hour cycle. The utility had been over-pumping during the day and under-pumping at night, causing pressure fluctuations that accelerated joint failures in the distribution mains.
The same pattern repeats across utilities. Assumptions about domestic consumption timing, school and office building usage, and the water demand of public institutions are almost always based on design estimates or outdated surveys. Continuous monitoring reveals that actual consumption patterns are driven by operational realities that no survey captures: a hospital that fills its rooftop tanks at 3:00 AM because the incoming pressure is higher, a housing society that runs its booster pump on a timer set incorrectly, a municipal garden that irrigates at midnight because the daytime water supply is unreliable. Each of these patterns affects the network's hydraulic behavior, and none of them are visible in monthly billing data or periodic field inspections.
The First Confirmed Leak Is Almost Never Where the Utility Expected It
When a utility deploys continuous monitoring, the engineering team typically has a mental list of problem areas-sections of the network that have a history of bursts, zones with older pipes, areas where complaints are frequent. The first confirmed leak from the monitoring system almost never falls within these expected locations. In a utility in Karnataka, the first alarm came from a DMA that was considered low-risk: a residential area with pipes installed only eight years earlier, no complaint history, and a flat pressure profile. The monitoring system flagged a night flow anomaly of 12 cubic meters per hour above the baseline. The field crew found a leaking ferrule connection at a service line that had been installed incorrectly during a road-widening project two years prior. The leak was underground, invisible from the surface, and had been flowing at an estimated 8 cubic meters per hour for 18 months.
The reason the leak was not discovered earlier is that the conventional detection method depends on visible evidence or complaint reporting. An underground leak at a service connection does not surface unless the water table rises or the soil saturates to the point of creating damp ground. In a well-drained soil with a deep water table, the leak can flow indefinitely without any surface indication. The monitoring system detected it not because the leak was large, but because the night flow baseline in that DMA was low enough that a 12 cubic meter per hour anomaly exceeded the alarm threshold. The utility's assumption that new pipes meant no leaks was based on an incomplete model of network behavior. Continuous monitoring replaced that assumption with data.
Operational Questions Replace Operational Assumptions by the End of Week Twelve
The most valuable output of the first 90 days is not the list of leaks found or the volume of water recovered. It is the set of operational questions that the monitoring data forces the utility to ask. Why does the night flow in DMA 7 spike every Wednesday at 4:00 AM when no scheduled event is logged? Why does the pressure at the zone inlet drop by 0.4 bar every time the downstream storage tank reaches 75 percent fill level? Why does the flow balance between DMA 4 and DMA 5 show a consistent 8 percent discrepancy that no meter calibration can explain? These questions have no immediate answer. They require investigation, field verification, and sometimes a redesign of the monitoring configuration itself.
But the act of asking them represents a fundamental shift in how the utility thinks about its network. Before continuous monitoring, the utility operated on the assumption that the network was stable unless a complaint proved otherwise. After 90 days of data, the utility understands that the network is dynamic, that anomalies are normal, and that the absence of a complaint does not mean the absence of a problem. The monitoring system has not solved every operational issue. It has revealed that the utility was solving the wrong problems, and that the real operational challenges were hidden in the gaps between monthly readings and field inspections. The first 90 days of continuous monitoring do not make a utility's job easier. They make it clearer-and that clarity is what drives every subsequent operational improvement.