A municipal water utility in a major Indian city reported 32 percent non-revenue water in its annual performance report. The NRW reduction program had been running for three years, focused entirely on leak detection, pressure management, and distribution main replacement. Physical losses dropped from 22 percent to 18 percent over that period. The overall NRW figure barely moved. What the utility had not disaggregated was the commercial component - meter inaccuracies, illegal connections, unbilled public standposts, and data handling errors that together accounted for the remaining 14 percent. The gap between what they had reduced and what remained unchanged was not a measurement problem. It was a classification problem. Without separating commercial from physical losses, the utility was optimizing the wrong variable.
Commercial Loss Components That Escape Standard NRW Calculations
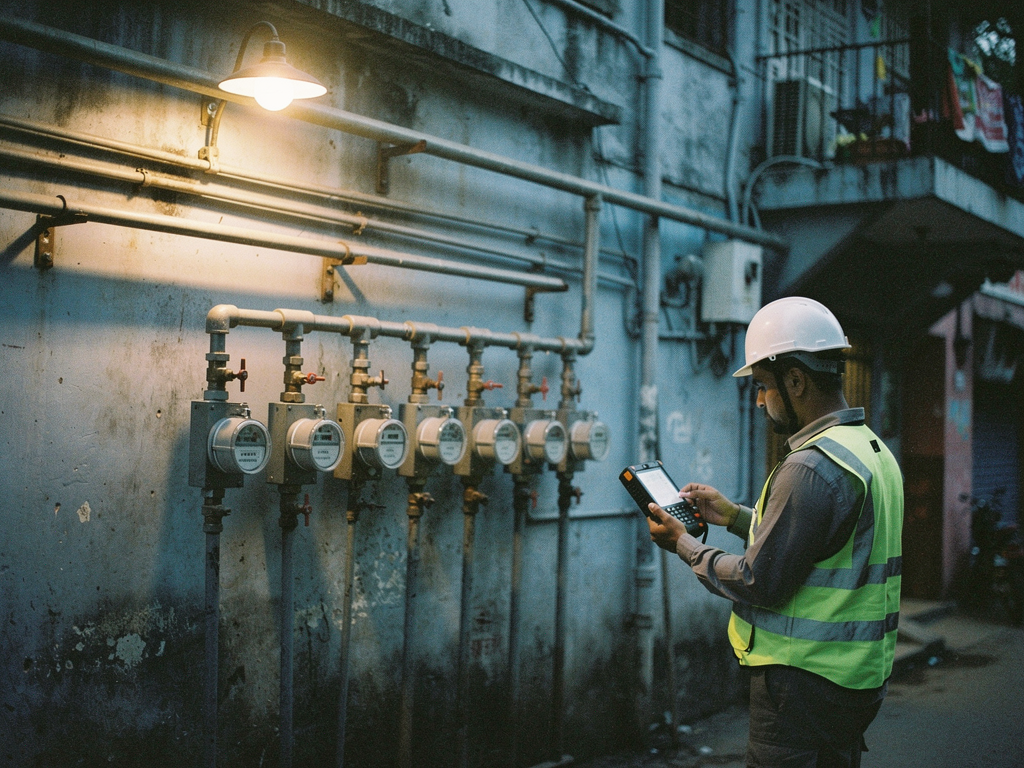
Commercial losses in an urban water network fall into three categories that behave differently and require different detection methods. The first is customer meter error - under-registration caused by mechanical wear, sediment buildup, oversizing, or tampering. A 20-year-old domestic meter with a worn impellor typically under-registers by 15 to 25 percent at low flow rates below 0.5 cubic meters per hour, which is exactly the flow range of a single household's overnight consumption. The utility bills based on what the meter shows, not what passes through it. The second category is unauthorised consumption - illegal connections tapped into distribution mains before the meter, bypasses around the meter, and direct connections to fire hydrants or public standposts that are not metered at all. The third is data handling loss - meter readers recording estimated readings, billing systems applying incorrect tariffs, and accounts that fall out of the billing cycle due to property subdivision or ownership changes. Each component produces a different signature in the data, but standard NRW calculations lump them into a single residual term after subtracting billed volume from production volume. The residual tells the utility how much water is lost. It does not tell them why.
The conventional approach to estimating these components relies on抽样 surveys and assumptions. A utility may conduct a meter accuracy test on a sample of 200 meters and extrapolate the error rate to the entire installed base of 50,000 connections. The assumption is that the sample represents the population - an assumption that fails when older meters cluster in certain zones, when sediment conditions vary by source water quality, or when tampering is concentrated in commercial areas. The result is a commercial loss estimate that is both imprecise and systematically underestimated, because the sampling bias almost always misses the worst-performing meters.
Meter Error Distribution and Its Effect on Revenue Loss Estimates
Customer meters do not fail suddenly. They degrade gradually, and the degradation pattern follows the meter's operating environment more closely than its age. A meter serving a household with intermittent supply experiences repeated air-slugging events that accelerate bearing wear. A meter downstream of a tuberculated iron main accumulates debris that reduces impellor rotation at low flows. A meter oversized for the actual consumption - a common problem in Indian residential connections where meters were selected for peak summer demand - operates in its lowest accuracy range for 90 percent of the year. The error is not uniform across the meter population. It is concentrated in specific zones, specific connection types, and specific flow regimes.
When a utility applies a flat correction factor of 10 percent to all billed volumes based on a city-wide sample, they overcorrect in zones with new meters and undercorrect in zones with old or degraded meters. The revenue loss from meter error in a zone with predominantly 15-year-old domestic meters can be three times the loss in a zone with five-year-old meters. Without zone-level flow monitoring, the utility cannot detect this variation. The production meter at the zone inlet reads the total volume delivered. The sum of customer meters reads the total volume billed. The difference is the zone NRW. But the utility cannot tell whether that difference is a burst on the distribution main, a leaking service connection, or a cluster of under-registering meters. They are managing a single number when they need six.
What the Gap Between Production and Billed Volume Actually Contains
Consider a residential zone with 2,500 connections that receives water from a single inlet. The production meter at the zone inlet records 4,200 cubic meters over a billing cycle. The sum of customer meter readings for the same period is 3,100 cubic meters. The gap is 1,100 cubic meters - 26 percent NRW. A conventional analysis would attribute most of this to physical losses. But when the utility installs a continuous flow monitor at the zone inlet and logs flow at 15-minute intervals, the pattern tells a different story. Night flow between midnight and 4 a.m. is 18 cubic meters per hour, which corresponds to a background leakage rate of approximately 3 cubic meters per hour per kilometer of main - within acceptable limits for a network of this age. The physical loss component is likely under 10 percent. The remaining 16 percent is commercial loss, and the utility has been treating it as a pipe problem for three years.
The disaggregation becomes clearer when the utility compares the gap across customer classes. In a commercial zone with 500 connections - restaurants, small shops, and office buildings - the gap between production and billed volume is consistently higher than in residential zones. The reason is not higher physical loss. Commercial meters are typically larger and more expensive, but they are also more frequently tampered with. A bypass installation around a 25-millimeter meter serving a restaurant can pass 15 to 20 cubic meters per month without any registration. The utility bills zero for that connection. The production meter records the flow. The gap widens. Without zone-level monitoring, the utility cannot distinguish a tampered commercial meter from a leaking service line. They send a leak detection crew to investigate a pipe that is not broken.
Why Continuous Zone Monitoring Changes Commercial Loss Estimation from Residual to Quantitative
The fundamental limitation of the residual method is that it conflates all losses into one number. Continuous flow monitoring at the zone inlet replaces the residual method with a component-based approach. The logic is straightforward. The utility measures total inflow to the zone continuously. They measure night minimum flow to estimate physical losses. They subtract the estimated physical loss from the total NRW to isolate the commercial component. They then compare the commercial component across zones, across customer classes, and across time to identify anomalies that point to specific failure modes.
A zone where the commercial loss component increases by 8 percent over three months without any change in the customer base or tariff structure is a zone with a problem. The utility can examine the customer meter data for that zone - looking for accounts with zero consumption, accounts with consumption below the minimum detectable threshold of the meter model installed, and accounts where consumption dropped sharply in the same period. They can send a field crew to inspect the ten highest-risk connections. They can install data loggers on suspect meters to capture the flow profile and compare it to the zone-level profile. The investigation is targeted. It is not a city-wide meter testing program that takes two years and costs several crore rupees. It is a data-driven inspection queue generated by the monitoring system.
The operational consequence is that commercial loss reduction becomes a measurable outcome rather than a budget line item. A utility that reduces commercial losses from 14 percent to 9 percent over twelve months has increased billed revenue by 5 percent of production volume without laying a single meter of new pipe. For a utility producing 200 million liters per day at an average tariff of 15 rupees per cubic meter, that 5 percent represents approximately 5.4 crore rupees in additional annual revenue - more than the cost of the monitoring system for the entire distribution network. The return is not theoretical. It is a direct function of the gap between what the production meter records and what the billing system collects.
The Pattern of Commercial Losses Differs Fundamentally by Supply Zone Characteristics
Residential zones with intermittent supply exhibit a commercial loss pattern dominated by meter degradation. The repeated air-slugging and flow surges during supply hours accelerate mechanical wear. A meter that under-registers by 8 percent in a continuous supply system may under-register by 18 percent in an intermittent system over the same service period. The utility that does not account for this difference will consistently underestimate commercial losses in intermittent-supply zones and overestimate physical losses, leading to misdirected investment in leak detection for networks where the primary loss is commercial.
Industrial zones present a different pattern. Large industrial connections typically have compound meters - a combination of a small meter for low flows and a large meter for high flows. The changeover valve between the two meters is a common failure point. If the valve sticks in the low-flow position during a high-flow production shift, the meter under-registers by 30 to 50 percent for that entire period. The utility bills based on the meter reading. The production meter at the zone inlet records the actual volume. The gap appears as unexplained NRW. Without continuous monitoring at both the zone inlet and the industrial customer's meter, the utility cannot diagnose whether the gap is a meter failure, a bypass, or a leak on the industrial service line. They send a leak detection crew to a site where the pipe is intact and the meter is broken.
What Utilities Discover When They Quantify Commercial Losses Separately
Utilities that have implemented zone-level monitoring and begun separating commercial from physical losses consistently find that the commercial component is larger than their pre-monitoring estimates. The reason is not that commercial losses increased. It is that the utility was systematically underestimating them. A utility that assumed commercial losses were 8 percent of production volume discovers they are 16 percent. The physical loss component is lower than assumed - not because the network is in better condition, but because the total NRW figure was inflated by commercial losses that the utility was attributing to leaks. The consequence is a complete reallocation of the NRW reduction budget. Money that was earmarked for pipe replacement is redirected to meter replacement, tamper-proof connections, and billing system upgrades. The return on investment improves because the interventions are now matched to the actual failure mode.
The operational shift is from managing NRW as a single target to managing two distinct targets with different drivers, different detection methods, and different intervention strategies. Physical loss reduction requires pressure management, leak detection, and infrastructure renewal. Commercial loss reduction requires meter accuracy management, connection integrity verification, and billing data quality. The two programs run in parallel, with separate budgets, separate performance indicators, and separate monitoring requirements. The zone-level flow monitor is the single instrument that makes this separation possible. Without it, the utility is flying blind - treating all losses as if they came from the same cause and expecting different results.
A utility that has operated under the assumption that physical losses dominate NRW for a decade does not change course overnight. The first step is to install continuous flow monitoring on a sample of zones - zones with different customer profiles, different supply patterns, and different meter ages. The data from those zones provides the evidence needed to reallocate resources. The utility that waits for perfect data before acting will wait indefinitely. The utility that starts monitoring a subset of zones and compares the commercial loss component across them will have actionable information within three billing cycles. That information is worth more than the monitoring system itself.