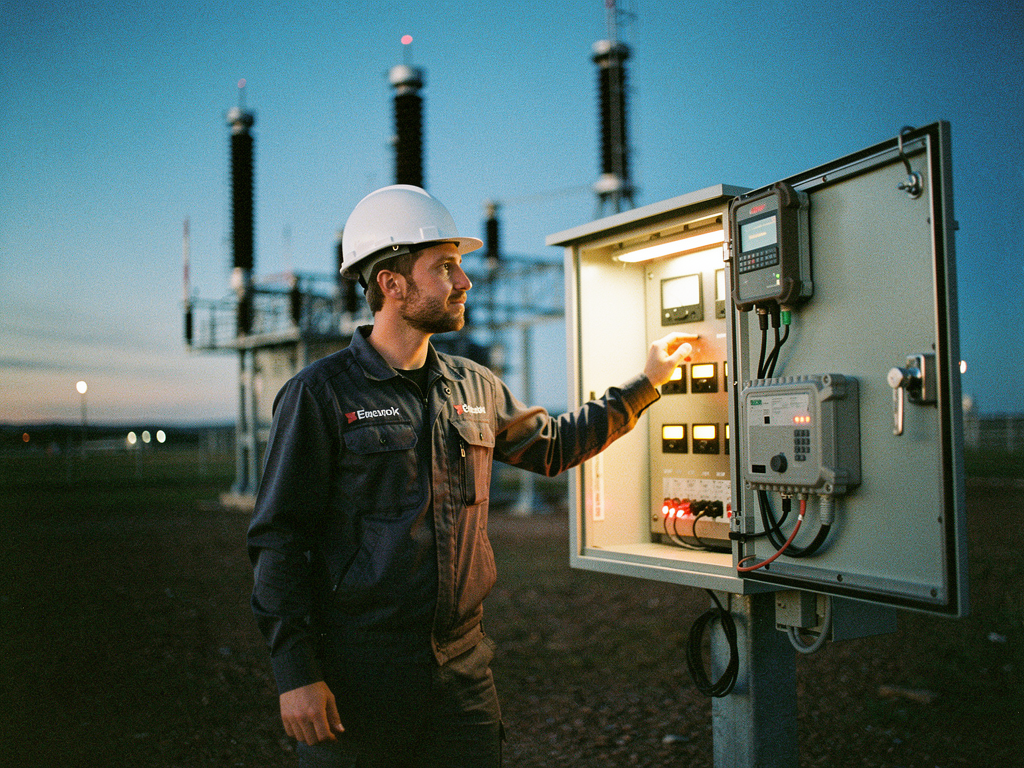
A 132 kV transformer at an industrial substation trips on over-temperature at 3:47 AM. The SCADA historian shows the oil temperature crossed 85 degrees Celsius exactly once in the preceding 72 hours - a single data point logged at 15-minute intervals. The protection relay triggered correctly. The threshold was breached. But the engineer reviewing the event the next morning cannot answer the only question that matters: was the temperature rising for six hours or six minutes before it hit the threshold? The historian does not store the trajectory. It stores the snapshot. Across India, thousands of critical infrastructure assets are monitored this way - point-in-time readings compared against fixed thresholds, generating alarms after the failure has already begun. The gap between what operators measure and what they need to know is not a sensor problem. It is an interval problem.
Point-in-Time Measurements Are a Snapshot of a Moving System
A pressure transducer at the inlet of a water distribution zone logs a reading of 4.2 bar at 00:00 hours. At 00:15, it logs 4.1 bar. At 00:30, it logs 4.0 bar. Each individual reading is within normal operating range. No threshold is crossed. No alarm is raised. But the sequence of readings tells a different story: the pressure is dropping at a rate of 0.1 bar per 15-minute interval. If this rate holds, the zone will fall below the minimum service pressure of 3.0 bar within the next 30 minutes. The point-in-time system sees nothing wrong. The trend-aware system sees a developing event with 30 minutes of lead time.
The fundamental limitation of threshold-based monitoring is that it treats every parameter as independent and static. A pump discharge pressure of 6.5 bar is acceptable at any instant, but if that same pressure was 7.2 bar thirty minutes ago, the 0.7 bar drop signals a developing problem - a failing non-return valve, a partially closed isolation valve, or a burst main downstream. The absolute value alone contains none of this information. The rate of change contains all of it.
Trend Analysis Reveals What Threshold Alerts Cannot
A threshold alert is a binary event: the value is either inside or outside the acceptable range. This works well for safety-critical parameters where any excursion requires immediate action - a motor winding temperature exceeding 155 degrees Celsius, for example, or a chlorine residual falling below 0.2 mg/L. But most infrastructure failures are not instantaneous. They develop over hours, days, or weeks. A bearing wear signature in a 500 kW pump motor appears as a gradual increase in vibration velocity from 4.5 mm/s to 7.2 mm/s over 14 days. No single reading crosses the alert threshold of 10 mm/s until day 15. By then, the bearing has already sustained damage that requires replacement rather than lubrication.
The operational intelligence gap here is not about sensor sensitivity. The vibration sensor was accurate throughout. The gap is about what the monitoring system does with the sequence of readings. A trend-aware system detects the slope of the vibration curve crossing a configurable rate-of-change threshold on day 4, when the value is still only 5.1 mm/s. The operator receives a notification not that something has failed, but that something is becoming wrong. The maintenance decision changes from emergency replacement to scheduled intervention. The cost difference between these two outcomes is often an order of magnitude.
Rate of Change Is More Diagnostic Than Absolute Value in Most Failure Modes
Consider a 250 kVA distribution transformer serving a mixed-use commercial building. The top oil temperature at 14:00 hours reads 72 degrees Celsius. This is below the 85-degree alarm threshold. But the rate of temperature rise over the preceding 90 minutes is 8 degrees per hour, compared to a historical baseline of 2 degrees per hour for the same ambient conditions. The rapid rise indicates a developing internal fault - a shorted turn in the low-voltage winding or a failing tap changer. The absolute value is normal. The rate of change is pathological.
This pattern repeats across infrastructure types. In a water pumping station, the rate of pressure decay after a pump trip tells an operator whether a check valve is holding or passing, which determines whether the standby pump can start safely. In a sewage lift station, the rate of wet-well level rise during a storm event determines whether the duty pump can keep pace or whether overflow is imminent. In a compressed air system, the rate of pressure drop during a no-load period reveals the total leakage orifice area. In every case, the diagnostic information is in the derivative, not the magnitude.
A monitoring architecture designed around rate-of-change analysis requires higher data resolution than a threshold-based system. A 15-minute logging interval captures the magnitude but obscures the slope for any failure that develops faster than 30 minutes. A one-minute logging interval captures the slope for most electromechanical failure modes. The data storage cost is higher, but the operational value - the ability to distinguish a developing fault from a static condition - is available at no additional sensor cost.
Behavioral Monitoring Requires Different Data Architecture Than Status Monitoring
Status monitoring answers the question: is this asset operating? Behavioral monitoring answers the question: is this asset operating the way it did yesterday, last week, or last season? The two questions require fundamentally different data handling. Status monitoring works with a single current value compared to a fixed threshold. Behavioral monitoring works with a rolling baseline, a rate-of-change calculation, and a deviation threshold that adapts to operating context.
A 24-hour pump schedule provides a clear example. A wastewater pump at a lift station runs from 06:00 to 08:00 and 18:00 to 20:00 daily, handling the morning and evening peak flows. Status monitoring confirms the pump starts and stops on schedule. But behavioral monitoring tracks the run duration per cycle. On day 1, the morning cycle runs for 47 minutes. On day 2, it runs for 52 minutes. On day 3, it runs for 59 minutes. The absolute flow rate readings are within normal range. But the increasing run duration indicates a gradual reduction in pump efficiency - a worn impeller, a partially blocked suction strainer, or a fouled check valve. The operator receives a notification on day 3, not when the pump fails to clear the wet well on day 14.
Implementing behavioral monitoring requires the telemetry system to store historical data locally or in the cloud with sufficient granularity to calculate rolling averages, standard deviations, and rate-of-change values. It also requires the analytics layer to distinguish between operational changes - a new pump speed setpoint, a different valve position - and genuine performance degradation. This is not a trivial software problem. But it is a solvable one, and the facilities that have implemented it report a measurable shift in maintenance patterns: fewer emergency callouts, more planned interventions, and longer mean time between failures for monitored assets.
The Operational Difference Between Knowing Something Is Wrong and Knowing Something Is Becoming Wrong
When a system tells an operator that something is wrong, the operator's options are limited. The asset has already failed or is about to fail. The response is reactive: dispatch a crew, locate the problem, perform emergency repairs. The downtime is measured in hours or days, depending on spare parts availability and crew response time. The cost includes not only the repair but also the production loss, the service interruption, and the collateral damage to downstream equipment.
When a system tells an operator that something is becoming wrong, the operator has a different set of options. The asset is still functional. The degradation is at an early stage. The response is proactive: schedule an inspection during the next planned shutdown, order the replacement part, prepare the work order. The downtime is measured in hours during a scheduled maintenance window, not days during an unplanned outage. The cost is the planned maintenance cost, which is typically 30 to 50 percent of the emergency repair cost for the same failure mode.
This operational difference is not theoretical. A municipal water utility in western India monitors 47 pump stations using trend analysis on motor current, discharge pressure, and vibration velocity. Over an 18-month period, the utility identified 12 developing bearing failures, 8 cavitation events, and 4 impeller wear conditions before any threshold was crossed. The average lead time between the trend alert and the predicted failure was 11 days. The utility scheduled all interventions during low-demand periods. No emergency pump failure occurred during that 18-month window.
Facilities That Have Made This Transition Make Different Investment Decisions
A facility that relies on threshold-based monitoring tends to invest in redundancy. If a pump fails without warning, the facility needs a standby pump that can start immediately. If a transformer trips without prior indication, the facility needs a backup feeder that can carry the load. The capital expenditure is driven by the unpredictability of failures. The mindset is: we cannot predict when this will fail, so we must have a spare ready.
A facility that uses trend-based monitoring makes a different calculation. If the monitoring system provides 10 to 14 days of warning before a bearing failure, the facility does not need a fully redundant pump for every duty station. It needs a single mobile standby unit that can be deployed when the trend alert is received. It needs a spare bearing kit in the store, not a complete pump assembly. The capital expenditure shifts from redundancy to maintainability. The operating expenditure shifts from emergency repairs to planned interventions.
This is not an argument against redundancy. Critical assets in water supply, power distribution, and industrial process lines will always require backup capacity. But the level of redundancy required - and therefore the capital cost - is directly related to how far in advance the facility can detect developing failures. A facility that can predict a failure 14 days in advance needs less standby capacity than one that cannot predict a failure at all. The monitoring architecture becomes a capital efficiency tool, not just an operational one.
Talk to Olectr about trend-based monitoring. The sensor is already there. The data is already being collected. The question is whether you are reading the snapshot or the story.