When a three-phase motor stalls and draws a sudden surge, the protective relay often records a brief trip and the line voltage dips by a few percent. Simultaneously, the power quality logger shows a spike in the 5th-order harmonic current while the overall THD reported on the main bus remains around 12 percent. The plant crew sees a motor fault but misses the underlying harmonic buildup that will later overheat the transformer windings and cause premature capacitor bank failure. The gap lies in relying on a single bus-level THD figure while the true stress is happening at individual equipment terminals.
Physical Origin of Harmonic Distortion in Non-Linear Loads
Variable frequency drives, switch-mode power supplies, and electronic load controllers draw current in short, high-amplitude pulses rather than a smooth sinusoid. Those pulses contain frequency components at integer multiples of the fundamental 50 Hz, creating harmonic currents that are mathematically represented by Fourier series terms. Each harmonic order adds a distinct voltage drop across the source impedance, and the cumulative effect distorts the waveform seen by downstream equipment.
When a VFD accelerates a motor, its input rectifier creates a dominant 5th-order current that can be three times the magnitude of the fundamental. The rectifier’s switching frequency introduces higher-order harmonics above the 25th, but their amplitudes decay quickly. The net result is a waveform whose crest factor exceeds 2.0, a clear sign that the load is non-linear and a source of harmonic injection into the plant’s distribution network.
Propagation Paths and Concentration Points for Harmonic Currents
Harmonic currents travel through the same conductors as the fundamental, but because impedance rises with frequency, they encounter higher voltage drops on longer or smaller-sized cables. Consequently, the voltage distortion is greatest at the far end of a feeder, especially where the conductor cross-section is reduced for cost savings. Neutral conductors, which carry the vector sum of all unbalanced harmonic currents, become hot spots for triplen harmonics (3rd, 9th, 15th), often reaching several hundred amperes in a three-phase system.
Transformer windings present another concentration point. The leakage reactance of a transformer is proportional to frequency, so higher-order harmonics see a much larger impedance, causing them to circulate within the core and generate localized heating. This internal circulation is invisible to external metering unless harmonic monitoring is placed at the transformer secondary terminals.
Equipment Consequences Beyond the Bus-Level THD Figure
Motors exposed to harmonic voltage distortion experience increased iron losses, which appear as excess heat in the stator core. A motor rated for 90 °C may see its hot-spot temperature rise by 10 °C when the 5th-order voltage distortion exceeds 4 percent of the fundamental. The insulation aging accelerates, shortening motor life well before any bearing failure is observed.
Capacitor banks used for power factor correction are particularly vulnerable to resonance with the system’s inductance. When the total harmonic distortion sits at 12 percent on the supply bus, the individual capacitor terminals can experience voltage peaks that are 1.3 times the nominal line voltage during a 7th-order resonance event. Those peaks cause dielectric breakdown, leading to capacitor popping and a sudden loss of reactive power support.
Why a 12 Percent Bus THD Understates Terminal Exposure
The THD figure reported by a central power quality analyzer is an RMS average of all harmonic components measured at a single point. It does not account for the voltage division that occurs across impedances downstream. In a typical plant, the impedance between the main bus and a motor terminal may be 0.05 Ω at the fundamental but rises to 0.3 Ω at the 5th harmonic, amplifying the local distortion to well above the bus reading.
Field engineers who rely solely on the bus THD may miss a scenario where a motor terminal sees a 20 percent distortion while the bus still reads 12 percent. That discrepancy becomes evident only when a portable harmonic analyzer is clamped at the equipment, revealing a localized voltage crest factor that exceeds safe operating limits.
Resonance Between Harmonics and Power Factor Correction Capacitors
When a plant installs a capacitor bank sized for a 0.95 power factor, the combined inductance of transformers and line reactance creates a resonant circuit at a specific harmonic order. If the 7th harmonic current from a VFD aligns with the resonant frequency, the circuit’s impedance drops dramatically, allowing that harmonic to surge to several times its normal magnitude. The resulting voltage amplification can push terminal voltages beyond the equipment’s insulation rating.
Detecting this condition requires continuous measurement of both harmonic current magnitude and system impedance. A sudden rise in the 7th-order current coupled with a drop in measured impedance at the same frequency signals that resonance is occurring, prompting operators to either detune the capacitor bank or shift VFD switching frequencies.
Continuous Harmonic Monitoring Reveals What Quarterly Surveys Miss
Quarterly power quality surveys typically capture a snapshot of the system under nominal load conditions. They often miss transient harmonic spikes that occur during motor start-up, load shedding, or process batch changes. Continuous monitoring with a 15-minute reporting interval records every harmonic event, building a statistical profile that highlights recurring peaks and emerging resonance conditions.
In a manufacturing plant that implemented continuous harmonic monitoring, the data showed that the 11th-order harmonic exceeded the 5 percent threshold during every shift change for three months. This pattern was invisible in the quarterly reports, yet it correlated with a gradual increase in transformer oil temperature. The plant adjusted its shift sequencing to stagger VFD start-ups, eliminating the recurring harmonic surge and stabilizing transformer temperatures.
Operational Decisions Informed by Real-Time Harmonic Insight
With live harmonic dashboards, operators can set alarm limits for each harmonic order based on equipment tolerances rather than a generic THD threshold. When the 9th-order current approaches the 3 percent limit at a motor terminal, the system automatically notifies the control room, allowing the operator to delay the next motor start or adjust the VFD’s PWM frequency.
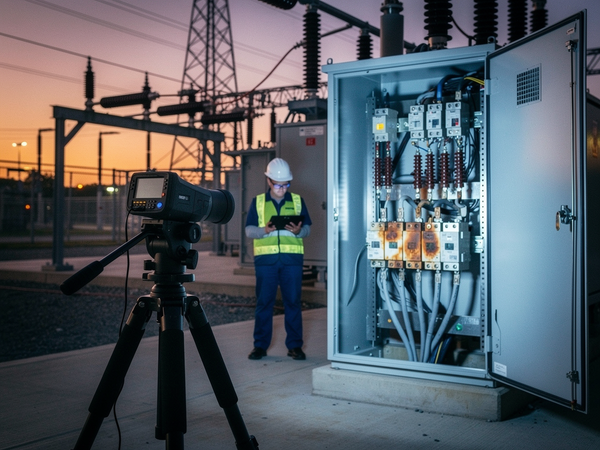
Maintenance managers also use the continuous data to prioritize inspections. A transformer that shows a persistent rise in the 5th-order voltage distortion will be scheduled for infrared thermography before insulation failure occurs. This proactive approach reduces unplanned outages and extends asset life without relying on costly full-scale harmonic surveys.
Closing the Visibility Gap with Continuous Power Quality Monitoring
The hidden stress caused by harmonics cannot be inferred from a single bus-level THD number. Only by deploying device-level harmonic sensors and aggregating the data in real time can plants see the true exposure of motors, transformers, and capacitor banks. Continuous monitoring transforms vague “THD compliance” into actionable insight, enabling precise adjustments that protect equipment and improve overall plant reliability.
See how Olectr monitors power quality continuously.