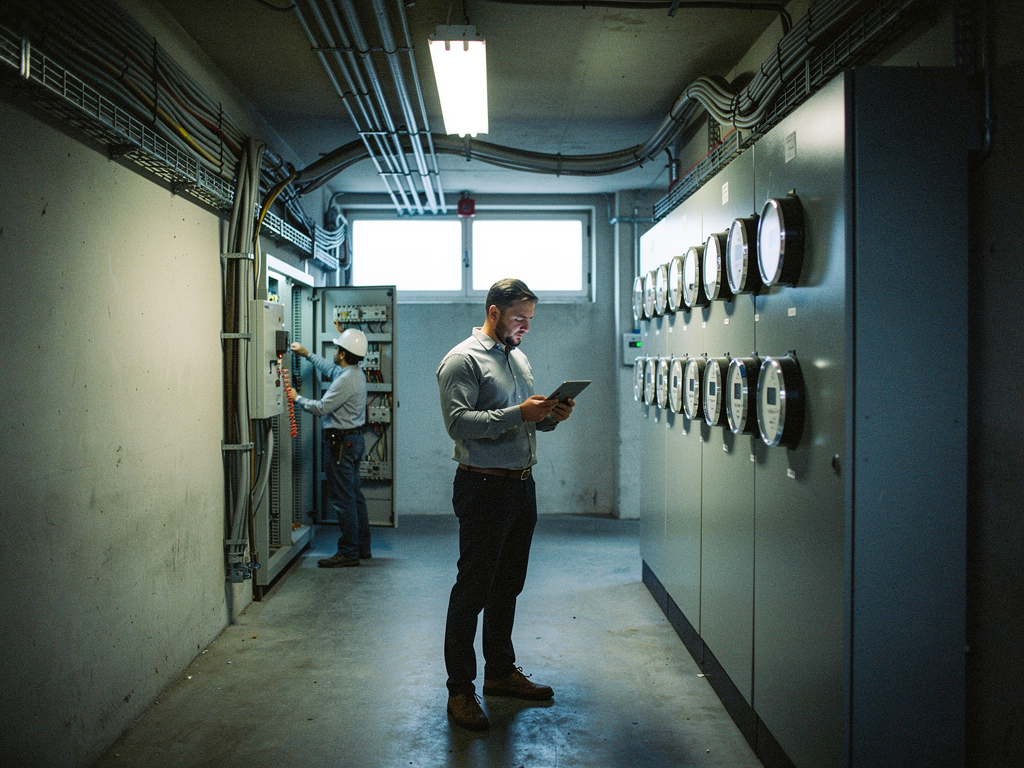
A textile manufacturer in an Indian state reports 3.2 million kilowatt-hours of annual electricity consumption in its BRSR filing. The number comes from the monthly utility bill, which covers the entire factory campus on a single meter. What the report does not show is that 40 percent of that energy passes through a 30-year-old distribution network where three substations have no sub-meters, two captive solar inverters feed into unmonitored busbars, and the night-shift load on the ring-main unit drops to 180 kilowatts while the billing demand charge is calculated against 520 kilowatts. The reported figure is technically correct. It is also operationally meaningless. The gap between what gets disclosed and what actually happens inside a facility is not a data problem - it is a measurement architecture problem that no spreadsheet can fix.
Reported Figures and Facility-Level Performance Diverge at the Substation Boundary
The standard ESG data chain in an Indian manufacturing facility runs from the utility meter to the accounts department to the sustainability team. The utility meter measures total import at the point of supply. That single number becomes the facility's annual energy consumption, which gets divided by production volume to calculate energy intensity. The problem is that a single import meter captures everything - production lines, HVAC, compressed air, lighting, canteen, administrative offices, and distribution losses within the campus. When a sustainability officer reports a 5 percent year-on-year reduction in energy intensity, they have no way of knowing whether that reduction came from an actual efficiency improvement or from a change in product mix that shifted load to an unmetered substation.
In a 50-acre industrial campus with four separate manufacturing blocks, the difference between the main import meter reading and the sum of all sub-meter readings routinely reaches 8 to 12 percent. That gap is distribution loss, unmeasured parasitic load, and meter drift combined. When the BRSR report uses only the import meter figure, it reports total consumption accurately but allocates it to the wrong processes. The energy intensity figure for the most energy-intensive production line looks artificially low because the line's actual consumption includes a share of the unmeasured campus load that nobody has attributed. The reported number passes an auditor's arithmetic check. It fails an operational check because it cannot be traced to any physical asset.
Billing Data and Sub-Meter Data Produce Different Truths for the Same Period
A municipal water utility in a major Indian city reports 85 million liters per day of supply in its ESG disclosure. The figure comes from the master flow meter at the treatment plant outlet. Downstream, twelve distribution zones each have inlet meters, but only seven of those meters are calibrated within acceptable tolerance. Two have been drifting for eighteen months. One was damaged during road work and replaced with a temporary insertion meter that was never commissioned properly. The utility's reported supply figure is the plant outlet reading minus an assumed 8 percent distribution loss. The actual volume entering the zones, measured at the twelve inlet meters, is 78 million liters per day. The difference - 7 million liters per day - is not real consumption. It is the accumulated error from a measurement system that has never been reconciled.
The same pattern appears in industrial energy reporting. A chemical plant in an Indian state reports 14.5 million kilowatt-hours of annual electricity use based on the main transformer meter. The plant has seven internal substations, each feeding a different process area. Three of those substations have energy meters that log data to a local display only - no remote collection, no historical trending, no integration with the plant's monitoring system. When a sustainability consultant audits the plant for BRSR compliance, they compare the main meter total against the sum of the seven substation meters. The discrepancy is 11 percent. The consultant flags it as a data quality issue. The plant manager explains it as panel meter inaccuracy and transformer losses. Neither explanation is verifiable because the plant has no independent measurement between the main meter and the process loads.
Annual Aggregates Conceal the Operational Dynamics That Drive ESG Performance
A single annual energy figure tells a sustainability team nothing about when or why consumption occurred. A textile plant that operates two shifts per day, five days per week, with a weekend maintenance load of 80 kilowatts, will report the same annual total whether its production schedule is stable or erratic. The annual aggregate cannot distinguish between a plant that runs at 70 percent load factor consistently and a plant that peaks at 95 percent during the day and drops to 15 percent at night. The load factor difference has direct implications for demand charges, transformer utilization, and Scope 2 emission intensity, but the annual figure hides all of it.
Consider a pharmaceutical facility that reports 8.2 million kilowatt-hours per year. The monthly breakdown shows a summer peak of 780,000 kilowatt-hours in May and a winter low of 580,000 kilowatt-hours in December. The difference is 200,000 kilowatt-hours per month - roughly 25 percent of the summer load. That variation comes from HVAC compressors that run at full capacity during the hot months and cycle intermittently during the cooler months. Without sub-metering on the HVAC system, the sustainability team cannot separate process energy from comfort conditioning energy. The annual aggregate reports the total correctly. It does not report that 1.2 million kilowatt-hours per year - 15 percent of the plant's total - goes to cooling alone, or that a chiller replacement with a 0.65 kilowatt per ton unit instead of the existing 0.95 kilowatt per ton unit would save 380,000 kilowatt-hours annually. The annual figure answers the compliance question. It does not answer the operational question.
Auditable ESG Data Requires Continuous Measurement, Not Monthly Snapshots
An auditor reviewing a BRSR filing can verify that a reported energy figure matches the utility bill. That verification confirms arithmetic accuracy. It does not confirm that the figure represents what the company claims it represents. When a company reports energy intensity per unit of production, the auditor needs to see that the energy measurement boundary matches the production measurement boundary. If the energy meter covers the entire campus and the production figure covers only one manufacturing block, the intensity calculation is structurally invalid regardless of how precisely the numbers are stated.
Continuous sub-metering changes this. When every process area has an energy meter that logs 15-minute interval data to a central platform, the auditor can verify that the sum of sub-meter readings matches the main meter reading within an acceptable tolerance - typically 2 to 3 percent for a well-maintained metering system. More importantly, the auditor can verify that the energy attributed to a specific production line corresponds to the hours that line was actually running. A line that reports 500 kilowatt-hours during a shift when it was down for maintenance is a data quality flag that no annual aggregate can reveal. Continuous monitoring does not just improve accuracy. It creates a traceable chain of measurement from the utility point of supply to the individual production asset. That traceability is what makes ESG data auditable.
Facilities with Continuous Monitoring Generate ESG Figures That Hold Up to Scrutiny
A large hospital in a major Indian city reports its energy and water consumption under BRSR with sub-meter data from twelve electrical panels and six water zones. The hospital's main energy meter reads 4.8 million kilowatt-hours annually. The sum of the twelve sub-meters reads 4.65 million kilowatt-hours. The difference is 3.1 percent, accounted for by transformer losses and panel metering uncertainty. The hospital can produce a 15-minute interval chart for every sub-meter for any day in the reporting period. When an investor asks how the hospital calculated its Scope 2 emissions, the sustainability team shows the interval data, the grid emission factor applied, and the reconciliation with the main meter. No assumptions. No allocations. No estimates.
The same hospital reports 42 million liters of annual water consumption. The main inlet meter reading is 43.2 million liters. The six zone meters sum to 41.8 million liters. The difference of 1.4 million liters is traced to a cooling tower bleed line that had no sub-meter during the first quarter of the reporting year. The hospital installed a meter on that line in April and can show the before-and-after data. The auditor accepts the reconciliation because the measurement gap is identified, quantified, and resolved within the reporting period. That level of transparency is impossible without continuous monitoring. It is also what separates a BRSR filing that satisfies the compliance requirement from one that actually demonstrates operational control.
The Next Phase of BRSR Enforcement Will Make Current Reporting Approaches Inadequate
The Securities and Exchange Board of India has signaled that BRSR Core disclosures will move toward limited assurance and eventually reasonable assurance. Limited assurance requires the auditor to verify that nothing in the report is obviously wrong. Reasonable assurance requires the auditor to verify that the report is materially correct. The difference is the difference between checking a utility bill and tracing a measurement chain. When reasonable assurance becomes mandatory, a company that reports energy consumption based on a single main meter with no sub-meter reconciliation will not be able to provide the evidence an auditor needs. The auditor will qualify the opinion, or the company will have to disclose the measurement uncertainty as a limitation.
Companies that already have continuous sub-metering in place will face no such limitation. Their data chain is already traceable. Their measurement uncertainty is already quantified. Their energy and water figures are already reconciled at the process level. The transition from limited to reasonable assurance will be a documentation exercise, not a measurement infrastructure rebuild. For everyone else, the transition will require installing sub-meters, establishing data collection systems, and building the operational discipline to maintain measurement accuracy across multiple sites and multiple reporting periods. The cost of that infrastructure is not trivial. The cost of not having it when assurance requirements tighten is a qualified audit opinion that no investor will ignore.